OIML BULLETIN - VOLUME LXV - NUMBER 3 - JULY 2024
t e c h n i q u e
Ensuring reliable vehicle emission inspection results with the use of certified reference materials
Najjy Hamad Al Yami
Abdullah Suleiman Al Owaysi
Abdulrahman Rashed Al Askar
Adel Bassuoni Shehata
Sultan K. Alharbi
Chemistry Department, National Measurement and Calibration Center (NMCC), Saudi Standards, Metrology and Quality Organization (SASO), Riyadh, Kingdom of Saudi Arabia
Abstract
This study investigates the influence of the CO/N2 certified reference material (CRM) on the results of the calibration of CO monitors used for the periodic inspection of vehicles at fixed stations. Four CO monitors were calibrated across the four seasons in various regions of Saudi Arabia. The calibration data using four CRM mole fractions (2200, 3500, 6800, 8200 µmol/mol) was analyzed to assess the impact of the seasons, regions, type of monitors and persons performing the calibration on data quality. The two tailed t-test at 95 % confidence level indicated that values of the slopes of the regression lines were not significantly different from zero, suggesting that the response values were consistent with the CRM value. In addition, the p-values exceeded 0.05 for all the CRMs and their responses confirmed the consistency found by the t-test. These findings ensure data integrity and accuracy, which is crucial for formulating effective air pollution control strategies and safeguarding public health and the environment.
1. Introduction
Periodic vehicle inspections at fixed stations serve as a crucial source of data for environmental control. The assessment of vehicle emissions leads to identification of those emissions that are non-compliant with the respective regulations [1]. However, the quality of the inspection data depends on a range of factors, each of which plays a significant role in ensuring the measurement accuracy. The selection of high-performance gas monitors and ensuring that their accuracy meets the requirements of the applicable international and regional standards in addition to ensuring that well-trained technicians are employed, represent the initial step towards securing reliable data [2].
CRMs are key to ensuring the accuracy of the equipment by comparing their readings with the certified value of a reference material, enabling the identification and correction of any measurement deviations [3]. Moreover, reference materials are used to ensure that the inspection measurement results are traceable to the SI. Ensuring traceability also facilitates the comparison of measurement results across diverse inspection monitors, even when situated in different geographical locations [4]. The measurement traceability fosters data comparability and enhances the reliability of the inspection data. The use of validated testing methods that guarantee accurate measurements significantly contributes to achieving reliable inspection results [5]. Moreover, the dedication of the relevant authorities to training technicians in the proper usage of measurement equipment and data analysis serves as an additional safeguard for data integrity and accuracy [2].
The present study aims to evaluate the impact of the CO/N2 CRM with other factors on the quality of periodical vehicle inspection results. This is carried out through the calibration of carbon monoxide (CO) monitors during the summer, winter, autumn, and spring across various geographical regions in Saudi Arabia, encompassing the north, east, middle and southwest. Calibration data of the CO monitors for each of the four CO CRM mole fractions: 2200, 3500, 6800 and 8200 µmol/mol was analyzed using linear regression models to determine whether any of the aforementioned factors exert an influence on the quality of the results [6]. This enabled the formulation of effective air pollution control strategies, whose effectiveness was evaluated with the objective of safeguarding public health and the environment.
2. Experimental
2.1 Equipment and methods
The CO exhaust monitors used in stations that carry out periodic technical inspections of vehicles were of models CET 210, CET2200C and CAP320-GAZ manufactured by CARTEC, Italy, CARTEC, Germany and VTEQ, France respectively. These monitors require a 10 min warm-up time and operate with a gas flow of 4 L/min, with a minimum acceptable flow of 2.5 L/min. The CO/N2 primary gas mixtures were produced at SASO/ NMCC in accordance with the requirements of ISO 6142, ISO 6143 and ISO 17034 [7]. The calibration was performed using the procedure described in a previous article [8].
3. Results and discussion
The CO monitors in the four visited fixed inspection stations were of different models and were calibrated in four geographical regions of Saudi Arabia as shown in Figure 1. Calibration was performed by two individuals, each calibrating two monitors in different seasons. The monitor in the north (N) was calibrated in the winter and the monitor in the southwest (SW) was calibrated in the summer. Meanwhile, the monitor in the east (E) was calibrated in the spring, and the monitor in the middle (M) was calibrated in the autumn.
Figure 1: The four regions in which calibration was performed as shown on a map of the Kingdom of Saudi Arabia
The calibration results were analyzed to see whether they were influenced by factors such as monitor type, region, season, and the person performing the calibration. This was investigated by noting the responses of each monitor to each calibration mole fraction of the CO CRM (2200, 3500, 6800, and 8200 µmol/mol). Table 1 shows the average of the five readings taken by each monitor for each CRM mole fraction across the four regions (E, SE, N, and M).
Table 1: Calibration results of the four monitors at four regions

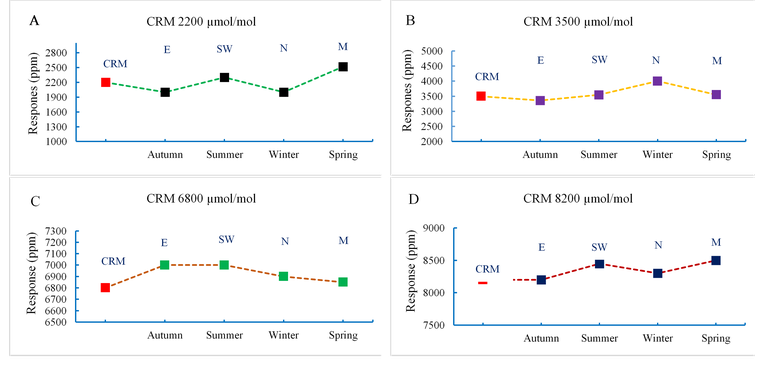
These results are represented graphically in Figure 1. Parts A, B, C, and D of the figure represent the responses of the four monitors to the CRM mole fractions of 2200 µmol/mol, 3500 µmol/mol, 6800 µmol/mol, and 8200 µmol/mol respectively. This analysis aims to determine the consistency of the response values from the four monitors with the corresponding CRM values across the different seasons.
Figure 2: Consistency line of each CRM mole fraction with its corresponding monitor responses
A two-tailed t-test was carried out in which the critical area of distribution is two-sided. This tests whether a sample is greater than or less than a certain range of values used to test whether the deviation of the slope from zero was significant. The t-statistic defined in equation 1 was calculated using degree of freedom n–2 (df = 3) and compared with the t-critical.

The slope b1 and the standard error s(b1) were calculated by using equations 2 and 3 respectively [9,10],


where,
xi - CRM mole fraction value
x̄ - average of CRM mole fractions
yi - monitor response value
ȳ - average of the response values
In addition, the p-values were calculated by the regression test and the calculated values of b1, s(b1) and p-values are shown in Table 2.
Table 2: t-statistic, t-critical and p-values

From Table 2, it can be seen that the t-statistics for the four CRMs (2200, 3500, 6800, and 8200 µmol/mol) calculated based on the responses in Table 1 are all less than or equal to 1. This indicates that the slope of each line consisting of the CRM value and the corresponding response values shown in Figure 1 is not statistically different from zero. In addition the p-value, which represents the probability of observing a t-statistic which is either less extreme than or more extreme than the one calculated, was typically used to assess significance. A common threshold for significance is 0.05. Since all the p-values in Table 2 are greater than 0.05, we can conclude that the response values are not statistically different across the CRM values.
4. Conclusion
This study investigated the calibration of CO monitors at fixed stations of periodical inspection of vehicles in different regions in Saudi Arabia. The calibration was carried out in different climate seasons using a CO/N2 gas mixture. The slope of the regression line for each CRM value and the corresponding response values of the four monitors did not deviate significantly from zero, indicating the consistency of the calibration results. The calibration results were found independent of the type of monitor, climate, season, geographical area, and the person performing the calibration.
5. References
- SASO (2022) Executive Regulations for Organizing Periodic Technical Inspection of Vehicles, 1st Edition.
- ISO/IEC 17025:2017. General requirements for the competence of testing and calibration laboratories.
- IUPAC (2022). Guidelines for the Selection and Use of Reference Materials.
- JCGM 200 (2012) International Vocabulary of Metrology-Basic and General Concepts and Associated Terms (VIM). 3rd Edition.
- Magnusson, B. and Omemark, U. (2014) Eurachem Guide: The Fitness for Purpose of Analytical Methods: A Laboratory Guide to Method Validation and Related Topics.
- Shehata, A.B., Alaskar, A.R., AlDosari, R. A. and AlMutiri, R. F. (2023). Characterization of the Calibration Results of Glass Electrode pH-Meters Using Buffer Solutions Certified by Different Producer, European Journal of Applied Sciences, 11, (6), 14-22.
- Shehata, A.B., Alyami, H.A., Alowaysi, A.S. and Alaskar, A.R. (2020) Preparation and Certification of Carbon Monoxide Gas Reference Material for the Quality of CO Emission Measurements. Journal of Chemical Metrology 1, 11-24.
- Shehata, A.B., Alaskar, A.R., Alyami, H.A., Alowaysi, A.S. and Alharbi S.K (2024). Calibration of CO and CO2 Monitors Used in Periodic Inspection of Vehicles at Fixed Stations for Environmental Control. Green and Sustainable Chemistry, 14, 29-41.
- ISO Guide 35 (2017): Reference materials-guidance for characterization and assessment of homogeneity and stability 4th Ed.
- Shehata, A.B., AlAskar, A.R., AlRasheed, M.A., AlZahrany, A.M., AlKharraa, F.A. and AlSowailem, S.A. (2023) Development of a Certified Reference Material from Caffeine Solution for Assuring the Quality of Food and Drug Measurements. Green and Sustainable Chemistry, 13, 216-236.


